Node.js debugging with Google Chrome
In node.js and Google Chrome you can debug applications directly from the dev tools.
node --inspect app.jsAfter running this, you’ll something like this in your terminal:
Debugger listening on ws://127.0.0.1:9229/cd59fbe7-7c0d-4d77-8ffa-6e3d77576bb2
For help see https://nodejs.org/en/docs/inspector
Debugger attached.
Now navigation to about:inspect in Chrome and that will redirect you to chrome://inspect and you’ll see a list of devices and a remote target.
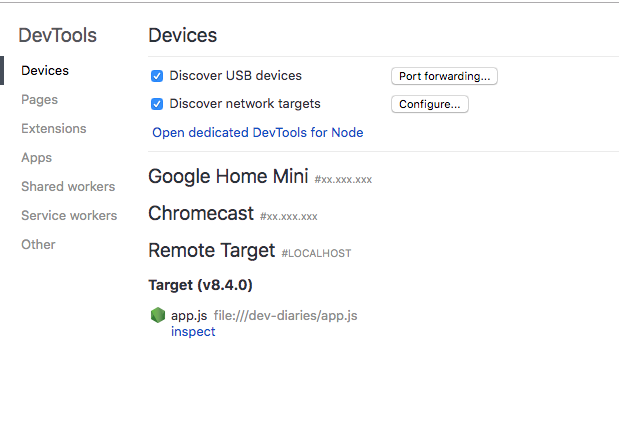
Click on inspect and that will take you to the dev tools which will allow you to create breakpoints, see source maps, console evaluation, heap snapshot inspect, and async stacks for promises.
If you’re using Typescript (one of our favorites) you can use ts-node to be able to inspect your typescript applications. You would use it so:
node --inspect --require ts-node/register app.tsIn your file sources, you’ll now see the typescript file and the compiled javascript file. Edit the typescript file to see any changes, as usual.
Read more about it here