Using Breakpoints In Dev Tools
Using breakpoints in the Google Chrome or Firefox devtools is one of the best ways to debug applications in javascript. A breakpoint is a point of code where the debugger will automatically pause the JavaScript execution. Breakpoints can give you deeper insight into objects, and let you debug easier because you can examine current variables, execute commands in the console and do whatever else you want to do to debug your application. How do we set breakpoints in dev tools?
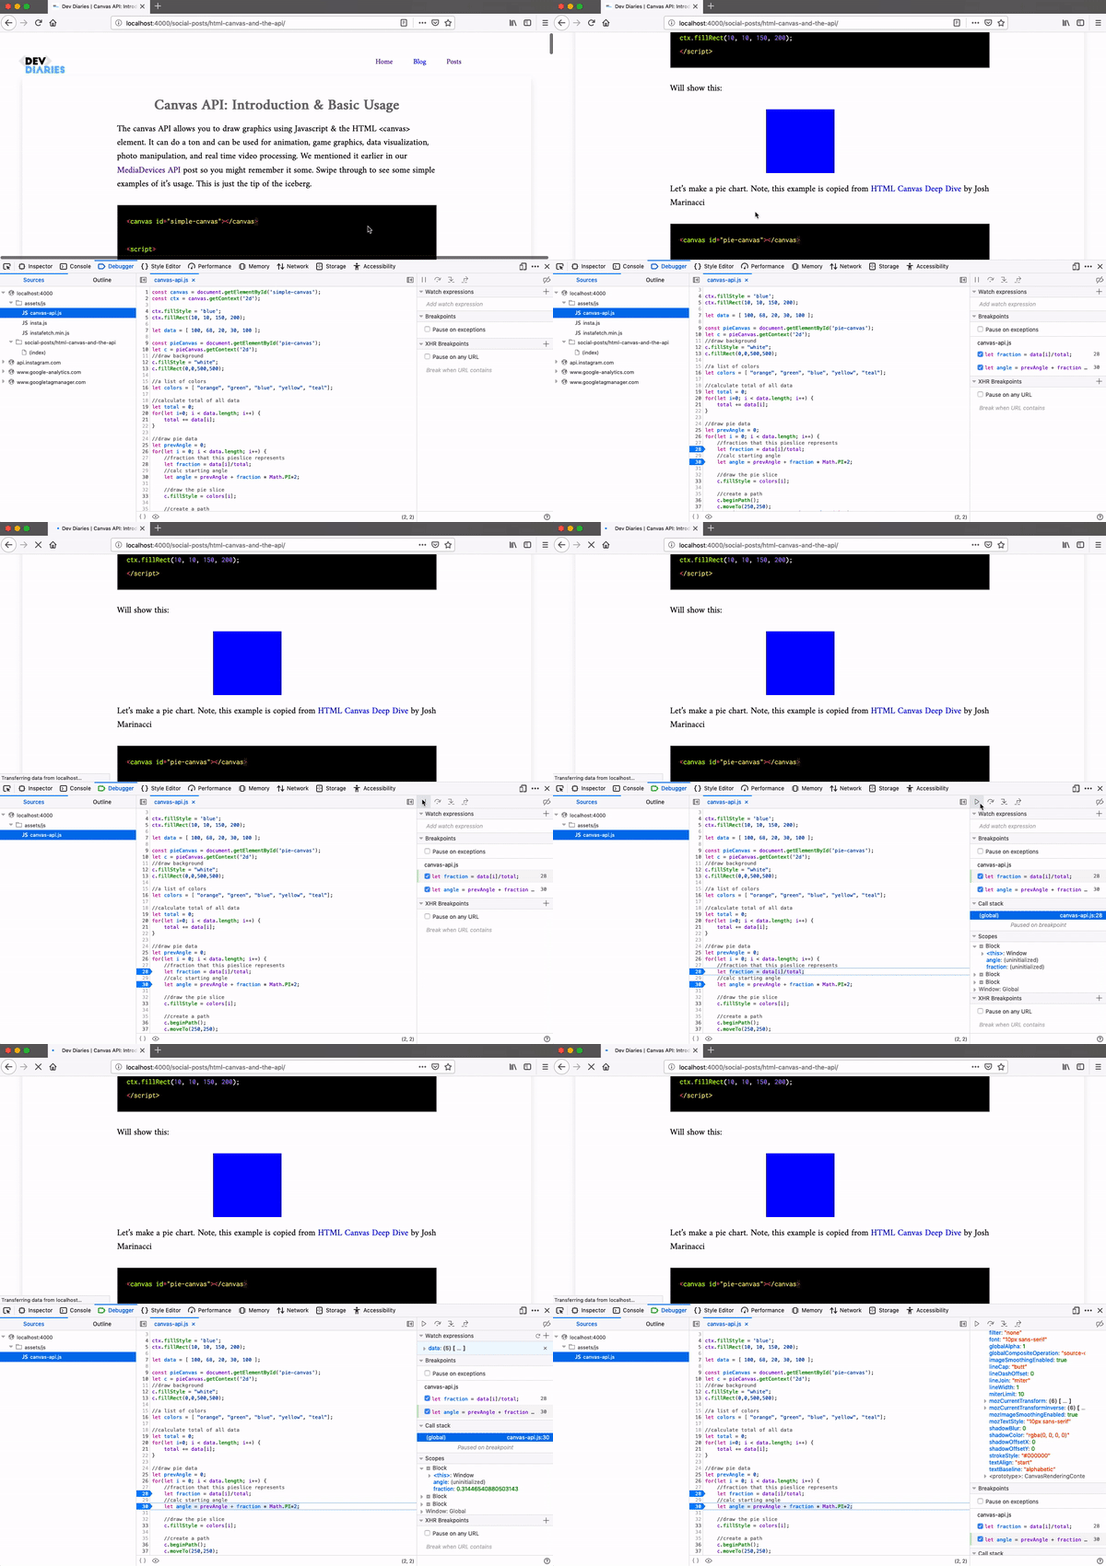
Check this Firefox Gif to see it in action:

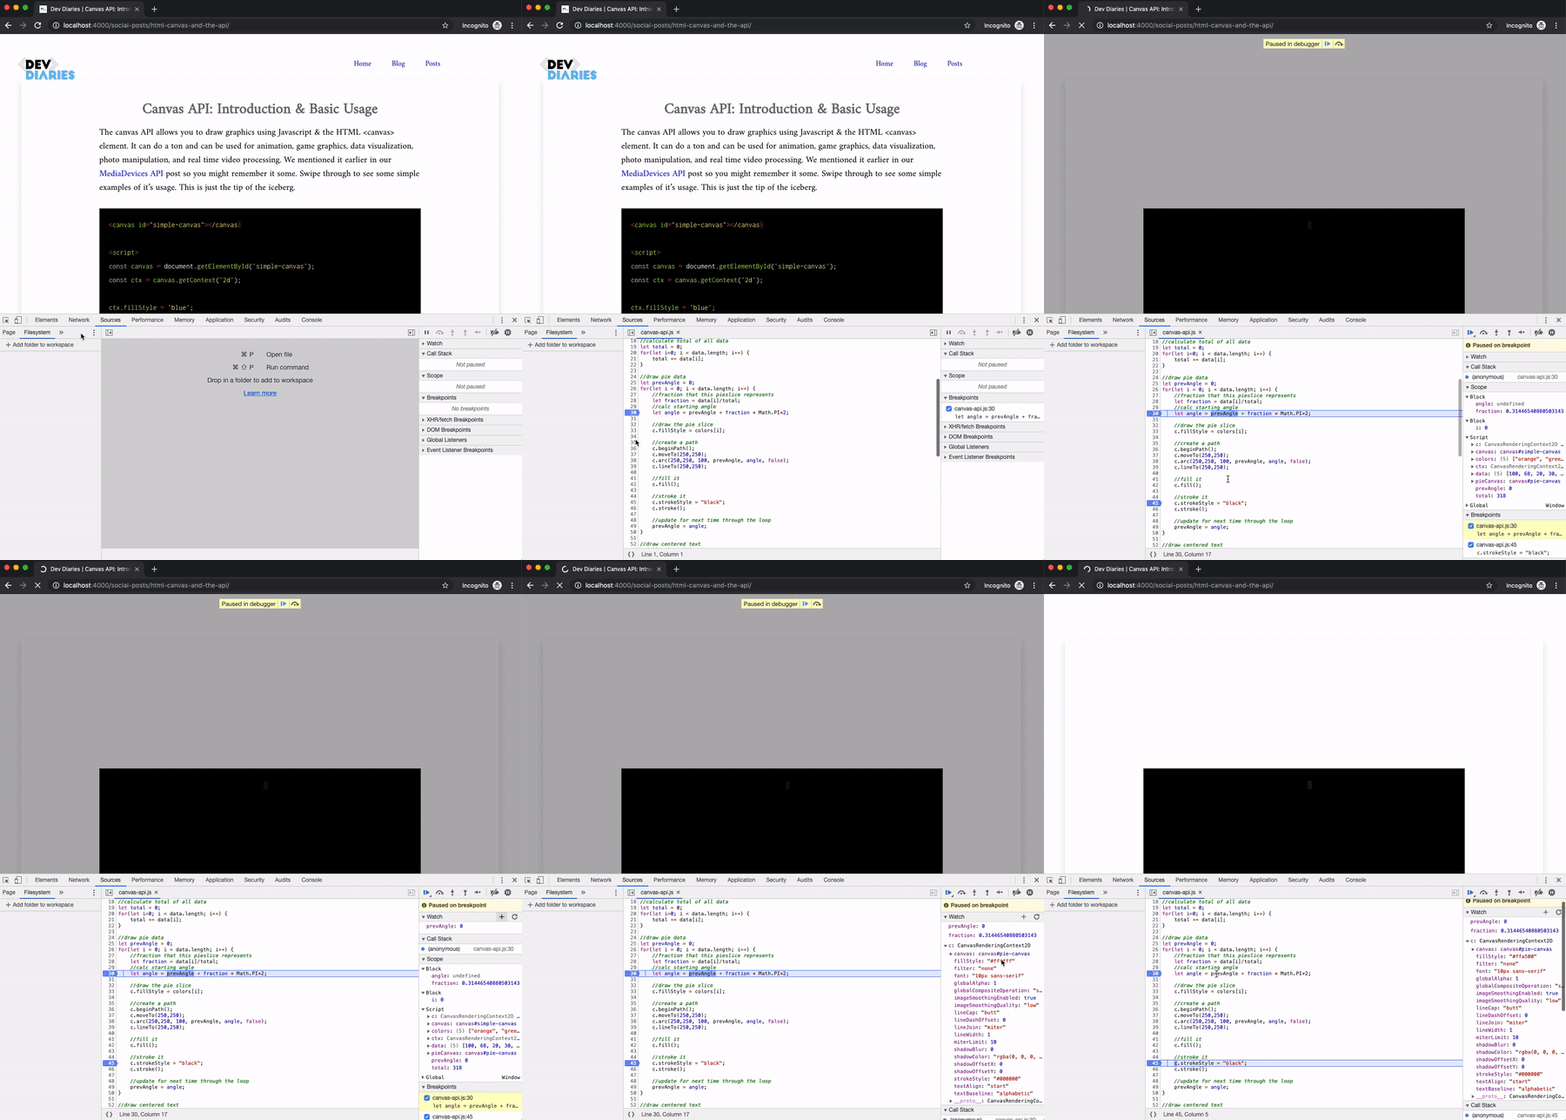
Check this Chrome Gif to see it in action:

As seen we can set a line for the code breakpoint and see the objects before the breakpoint. We can also watch certain variables using the “Watch” area which is very useful to track variables.
See the Firefox Docs for breakpoints and see the Chrome Docs for breakpoints